
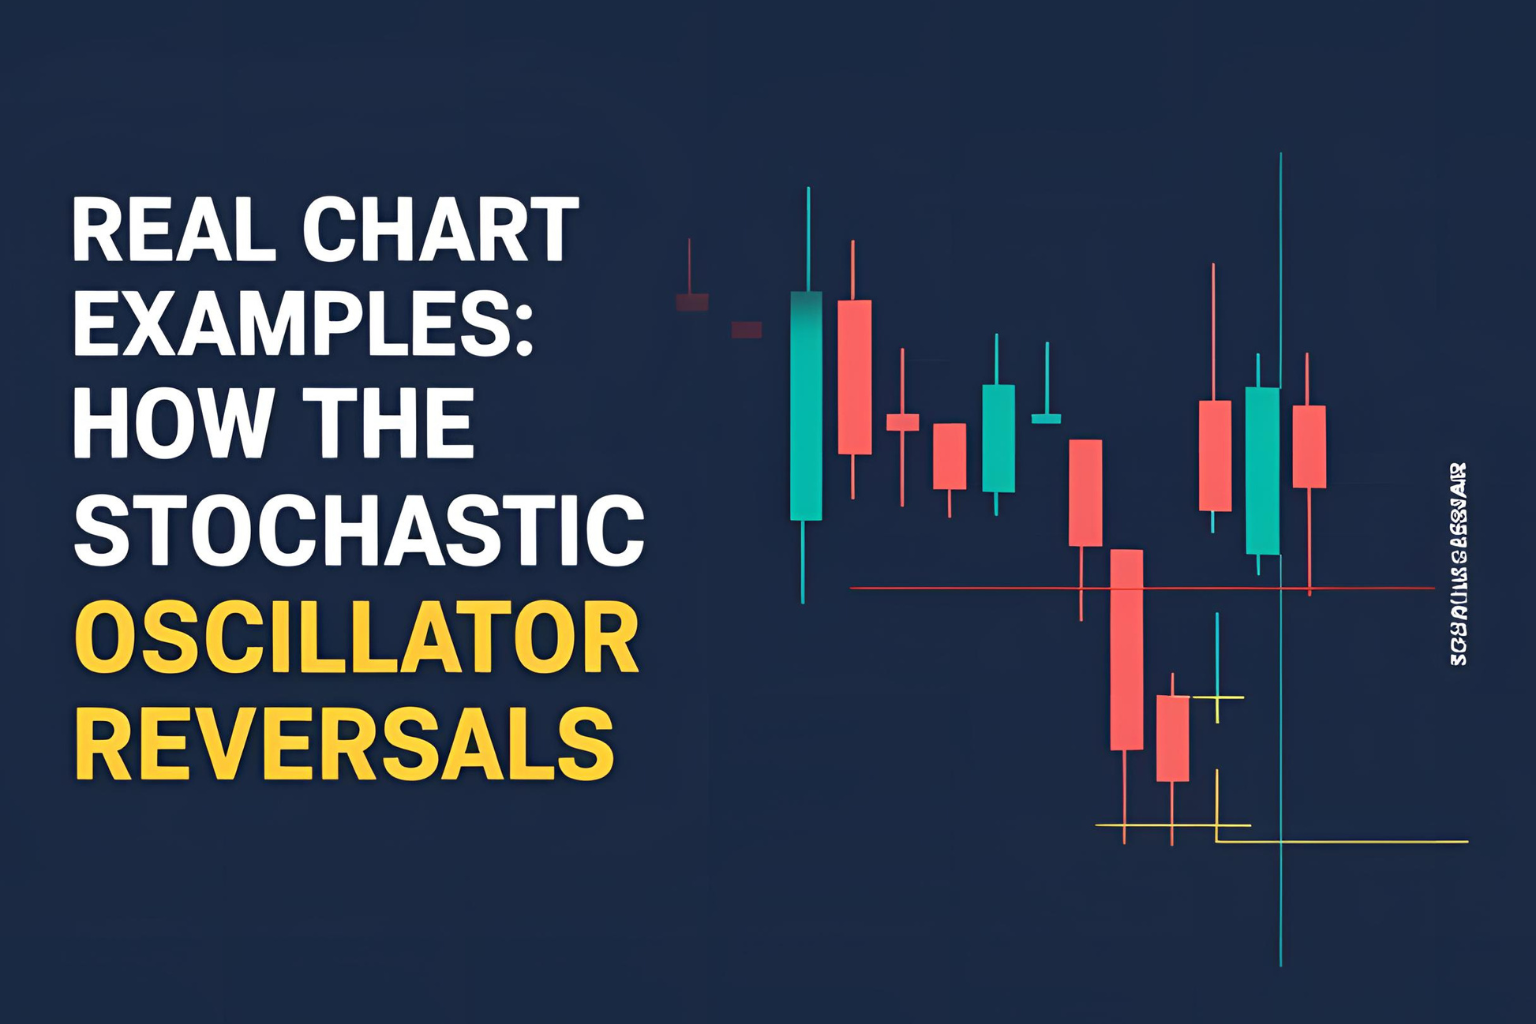
Real Chart Examples: How the Stochastic Oscillator Predicted Reversals
Introduction
While theory is important, real-world examples are where traders truly understand how indicators behave. The stochastic oscillator is particularly effective in spotting market reversals, especially when paired with price action and volume. In this article, we’ll walk through real chart scenarios where the stochastic oscillator predicted reversals—and explain why it worked.
1. Bullish Reversal at Oversold Support (Daily Chart)
Stock Example: ABC Corp
Chart Setup: Daily timeframe
Observation:
- Price reached key horizontal support
- %K crossed above %D below the 20 level (oversold)
- Stochastic showed a bullish divergence (price made a lower low, stochastic made a higher low)
Outcome:
Stock reversed and rallied 12% in the following 6 sessions.
Why it worked:
- Signal occurred at a major support zone
- Multiple forms of confirmation (divergence + crossover)
2. Bearish Reversal from Overbought Resistance (Hourly Chart)
Asset: Nasdaq Futures (NQ)
Chart Setup: 1-hour timeframe
Observation:
- Price hit previous resistance level
- Stochastic %K crossed below %D above 80
- MACD histogram started declining
Outcome:
Short-term drop of 100 points within the next few hours.
Why it worked:
- Classic overbought setup near resistance
- Combined momentum loss and trend exhaustion
3. Weekly Reversal Before a Long-Term Uptrend
Asset: Tesla (TSLA)
Chart Setup: Weekly timeframe
Observation:
- Stochastic %K crossed above %D below 20
- The crossover occurred after a multi-month downtrend
- Volume spiked on bullish engulfing candle
Outcome:
Stock began a 6-month uptrend, gaining over 40%.
Why it worked:
- Weekly stochastic reversals tend to signal macro trend changes
- Volume and candlestick pattern confirmed the signal
4. Fakeout Signal in a Strong Trend (Learning Opportunity)
Stock: XYZ Corp
Chart Setup: 15-min timeframe
Observation:
- %K crossed below %D above 80
- Appeared to be a sell signal
- Price broke out instead and moved 5% higher
Lesson:
- Signal happened in a strong uptrend
- No confirmation from price action or resistance levels
Takeaway:
Even valid stochastic signals can fail if taken against the trend.
Tips for Spotting Reversals with Stochastic
- Always confirm with price structure (support/resistance, trendlines)
- Look for divergence to support the reversal case
- Use volume or another momentum indicator (like MACD) for confirmation
- Practice with historical charts and backtesting tools
Conclusion
The stochastic oscillator predicted reversals in each of these real scenarios because it was used in context. It’s not just about crossovers—it’s about where they happen and how they align with price and volume. By studying charts like these, traders can refine their edge and avoid common mistakes.
FAQs
Q1. Can stochastic always predict reversals?
No indicator is perfect, but stochastic performs well with confirmation.
Q2. Is divergence necessary for a reversal?
Not always, but it adds strong credibility to the signal.
Q3. Are reversal signals stronger on higher timeframes?
Yes. Weekly and daily stochastic signals tend to be more reliable.
Q4. How do I find these examples myself?
Use platforms like TradingView to scroll back and study past setups.
Q5. Should I trade all stochastic reversals?
No. Focus on high-probability ones with multiple confirmations.


