Weekly vs Daily Timeframes: Best Use of the Stochastic Oscillator
Introduction
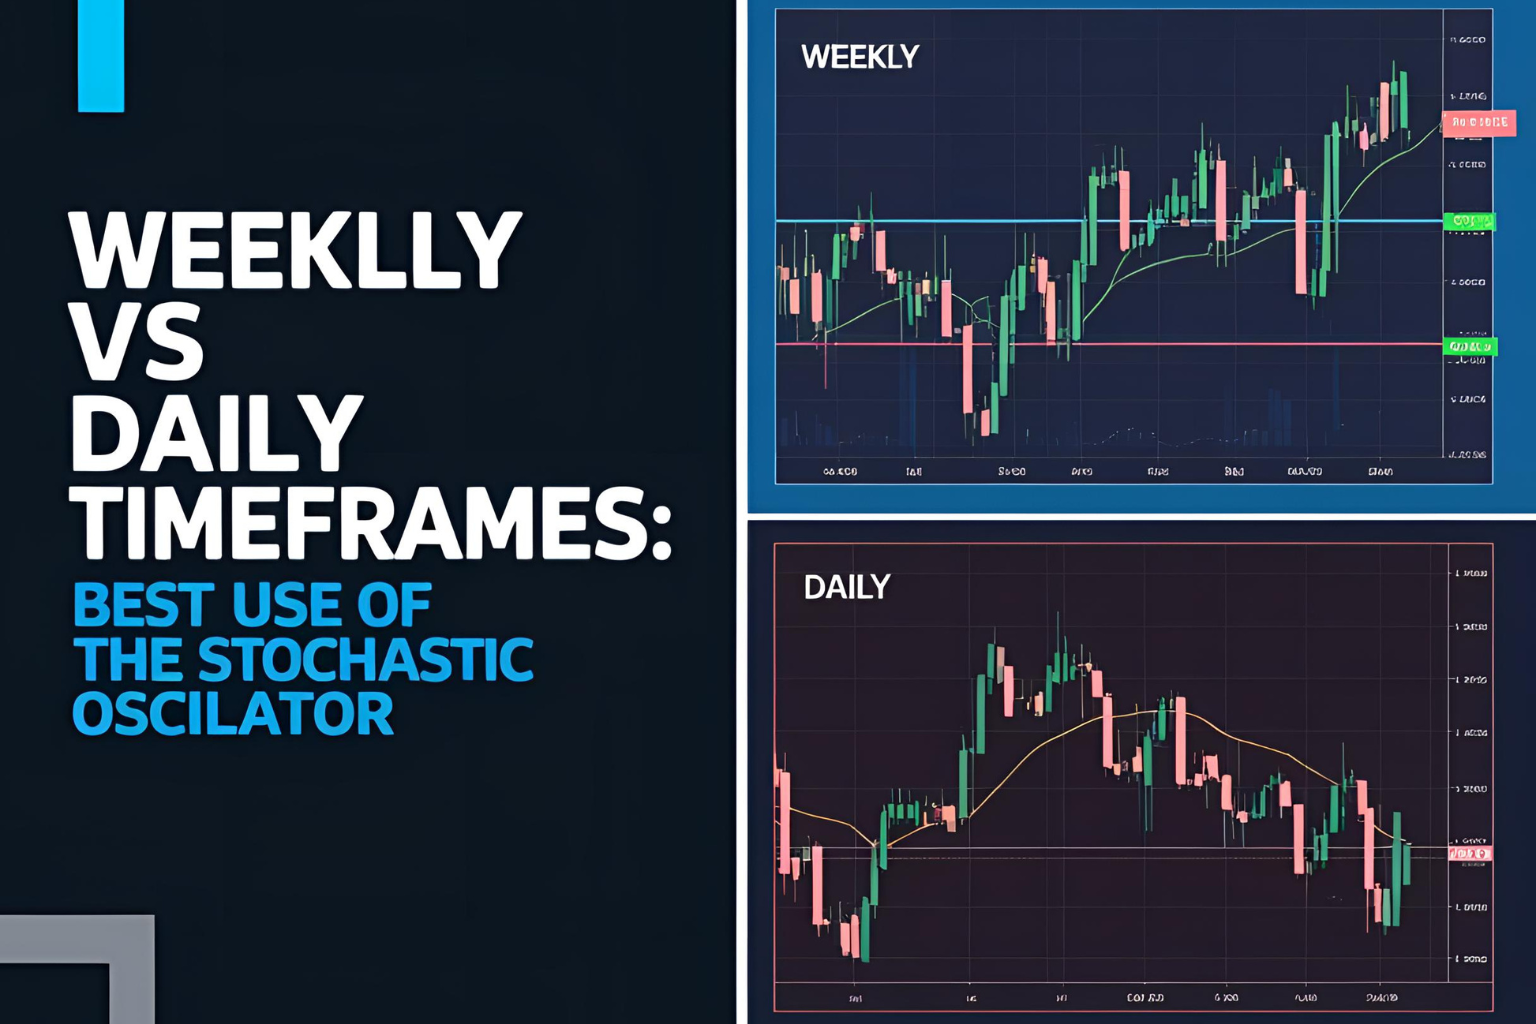
Timeframe selection is a major factor in how effective the stochastic oscillator will be in your trading. Both weekly and daily charts offer different advantages and serve different trading styles. In this post, we’ll explore the comparison between weekly vs daily stochastic oscillator usage and how to decide which is best for your strategy.
The Role of Timeframes in Trading
The stochastic oscillator works across all timeframes, but the signals it generates vary in strength, speed, and reliability based on the chart you’re using.
Using the Stochastic Oscillator on a Daily Chart
✅ Pros:
- Generates more signals, making it ideal for active traders and swing traders
- Captures short-term momentum changes
- Easier to adapt for entries and exits within 2–10 day windows
⚠️ Cons:
- More false signals due to market noise
- Requires tighter risk management to avoid whipsaws
Best for:
- Swing trading strategies
- Stocks with consistent daily volatility
- Quick trend reversal spotting
Example:
If %K crosses above %D below 20 on the daily chart, it can signal a short-term rally within the week.
Using the Stochastic Oscillator on a Weekly Chart
✅ Pros:
- Stronger signals with reduced noise
- Great for long-term trend analysis and position trading
- Helps identify major turning points
⚠️ Cons:
- Fewer signals; may miss shorter-term opportunities
- Not suitable for active intraday or swing trading
Best for:
- Long-term investors
- Portfolio managers
- Macro trend identification
Example:
A bullish crossover on the weekly stochastic after a long decline may mark the start of a new multi-week trend.
Comparison Table
| Feature | Daily Chart | Weekly Chart |
|---|---|---|
| Signal Frequency | High | Low |
| Noise | Moderate to High | Low |
| Trend Focus | Short-term | Medium to Long-term |
| Use Case | Swing trading, short-term setups | Position trading, long-term analysis |
| Signal Reliability | Medium | High |
How to Combine Both for Better Accuracy
Many traders use a multi-timeframe approach:
- Start with the weekly chart to identify overall market bias
- Drop down to the daily chart to pinpoint precise entry or exit based on stochastic signals
This helps filter out low-quality trades and improve timing.
Conclusion
When comparing the weekly vs daily stochastic oscillator, the choice depends on your trading goals. Use daily for active swing trades and weekly for higher-quality, long-term opportunities. Combining both can enhance your strategy by aligning momentum with broader trends.
FAQs
Q1. Which timeframe is more accurate for stochastic signals?
Weekly charts offer more reliable signals due to reduced noise.
Q2. Can I use stochastic on both timeframes together?
Yes, using a multi-timeframe strategy often improves accuracy.
Q3. Is daily stochastic good for swing trading?
Absolutely—it’s ideal for trades lasting a few days to a week.
Q4. What setting should I use on weekly charts?
Stick with 14,3,3 or test 21,5,5 for even smoother signals.
Q5. How do institutions use weekly stochastic?
Often to confirm major market turning points and long-term positioning.